> ## Documentation Index
> Fetch the complete documentation index at: https://portkey-docs-feat-rerank-documentation.mintlify.site/llms.txt
> Use this file to discover all available pages before exploring further.
# Traceloop (OpenLLMetry)
[Traceloop's OpenLLMetry](https://www.traceloop.com/docs/openllmetry/introduction) is an open source project that allows you to easily start monitoring and debugging the execution of your LLM app.
Traceloop's non-intrusive instrumentation combined with Portkey's intelligent gateway provides comprehensive observability without modifying your application code, while adding routing intelligence, caching, and failover capabilities.
## Why Traceloop + Portkey?
Automatic instrumentation without changing your application code
Built on industry-standard OpenTelemetry for maximum compatibility
Send traces to Portkey or any OpenTelemetry-compatible backend
Portkey adds gateway features like caching, fallbacks, and load balancing
## Quick Start
### Prerequisites
* Python
* Portkey account with API key
* OpenAI API key (or add it to [Model Catalog](/product/model-catalog))
### Step 1: Install Dependencies
Install the required packages for Traceloop and Portkey integration:
```bash theme={"system"}
pip install openai traceloop-sdk portkey-ai
```
### Step 2: Initialize Traceloop
Configure Traceloop to send traces to Portkey's OpenTelemetry endpoint:
```python theme={"system"}
from traceloop.sdk import Traceloop
# Initialize Traceloop with Portkey's endpoint
Traceloop.init(
disable_batch=True, # Process traces immediately
api_endpoint="https://api.portkey.ai/v1/logs/otel",
headers="x-portkey-api-key=YOUR_PORTKEY_API_KEY",
telemetry_enabled=False # Disable Traceloop's own telemetry
)
```
### Step 3: Configure Portkey Gateway
Set up the OpenAI client to use Portkey's intelligent gateway:
```python theme={"system"}
from openai import OpenAI
from portkey_ai import createHeaders
# Use Portkey's gateway for intelligent routing
client = OpenAI(
api_key="PORTKEY_API_KEY",
base_url="https://api.portkey.ai/v1",
default_headers=createHeaders(
api_key="PORTKEY_API_KEY",
provider="@openai-prod" # Your AI Provider slug from Model Catalog
)
)
```
### Step 4: Make Instrumented LLM Calls
Your LLM calls are now automatically traced by Traceloop and enhanced by Portkey:
```python theme={"system"}
# Make calls through Portkey's gateway
# Traceloop automatically instruments the call
response = client.chat.completions.create(
model="gpt-4o",
messages=[{"role": "user", "content": "Explain the benefits of OpenTelemetry for LLM applications"}],
temperature=0.7
)
print(response.choices[0].message.content)
# You now get:
# 1. Automatic, non-intrusive tracing from Traceloop
# 2. Gateway features from Portkey (caching, fallbacks, routing)
# 3. Combined insights in Portkey's dashboard
```
## Complete Example
Here's a full example bringing everything together:
```python theme={"system"}
from traceloop.sdk import Traceloop
from openai import OpenAI
from portkey_ai import createHeaders
# Step 1: Initialize Traceloop with Portkey endpoint
Traceloop.init(
disable_batch=True,
api_endpoint="https://api.portkey.ai/v1/logs/otel",
headers="x-portkey-api-key=YOUR_PORTKEY_API_KEY",
telemetry_enabled=False
)
# Step 2: Configure Portkey Gateway
client = OpenAI(
api_key="PORTKEY_API_KEY",
base_url="https://api.portkey.ai/v1",
default_headers=createHeaders(
api_key="PORTKEY_API_KEY",
provider="@openai-prod"
)
)
# Step 3: Make instrumented calls
response = client.chat.completions.create(
model="gpt-4o",
messages=[
{"role": "system", "content": "You are a helpful assistant."},
{"role": "user", "content": "What makes observability important for production AI?"}
]
)
print(response.choices[0].message.content)
```
## Next Steps
Set up intelligent routing, fallbacks, and caching
Manage AI providers, credentials, and model access centrally
Analyze costs, performance, and usage patterns
Configure alerts for anomalies and performance issues
***
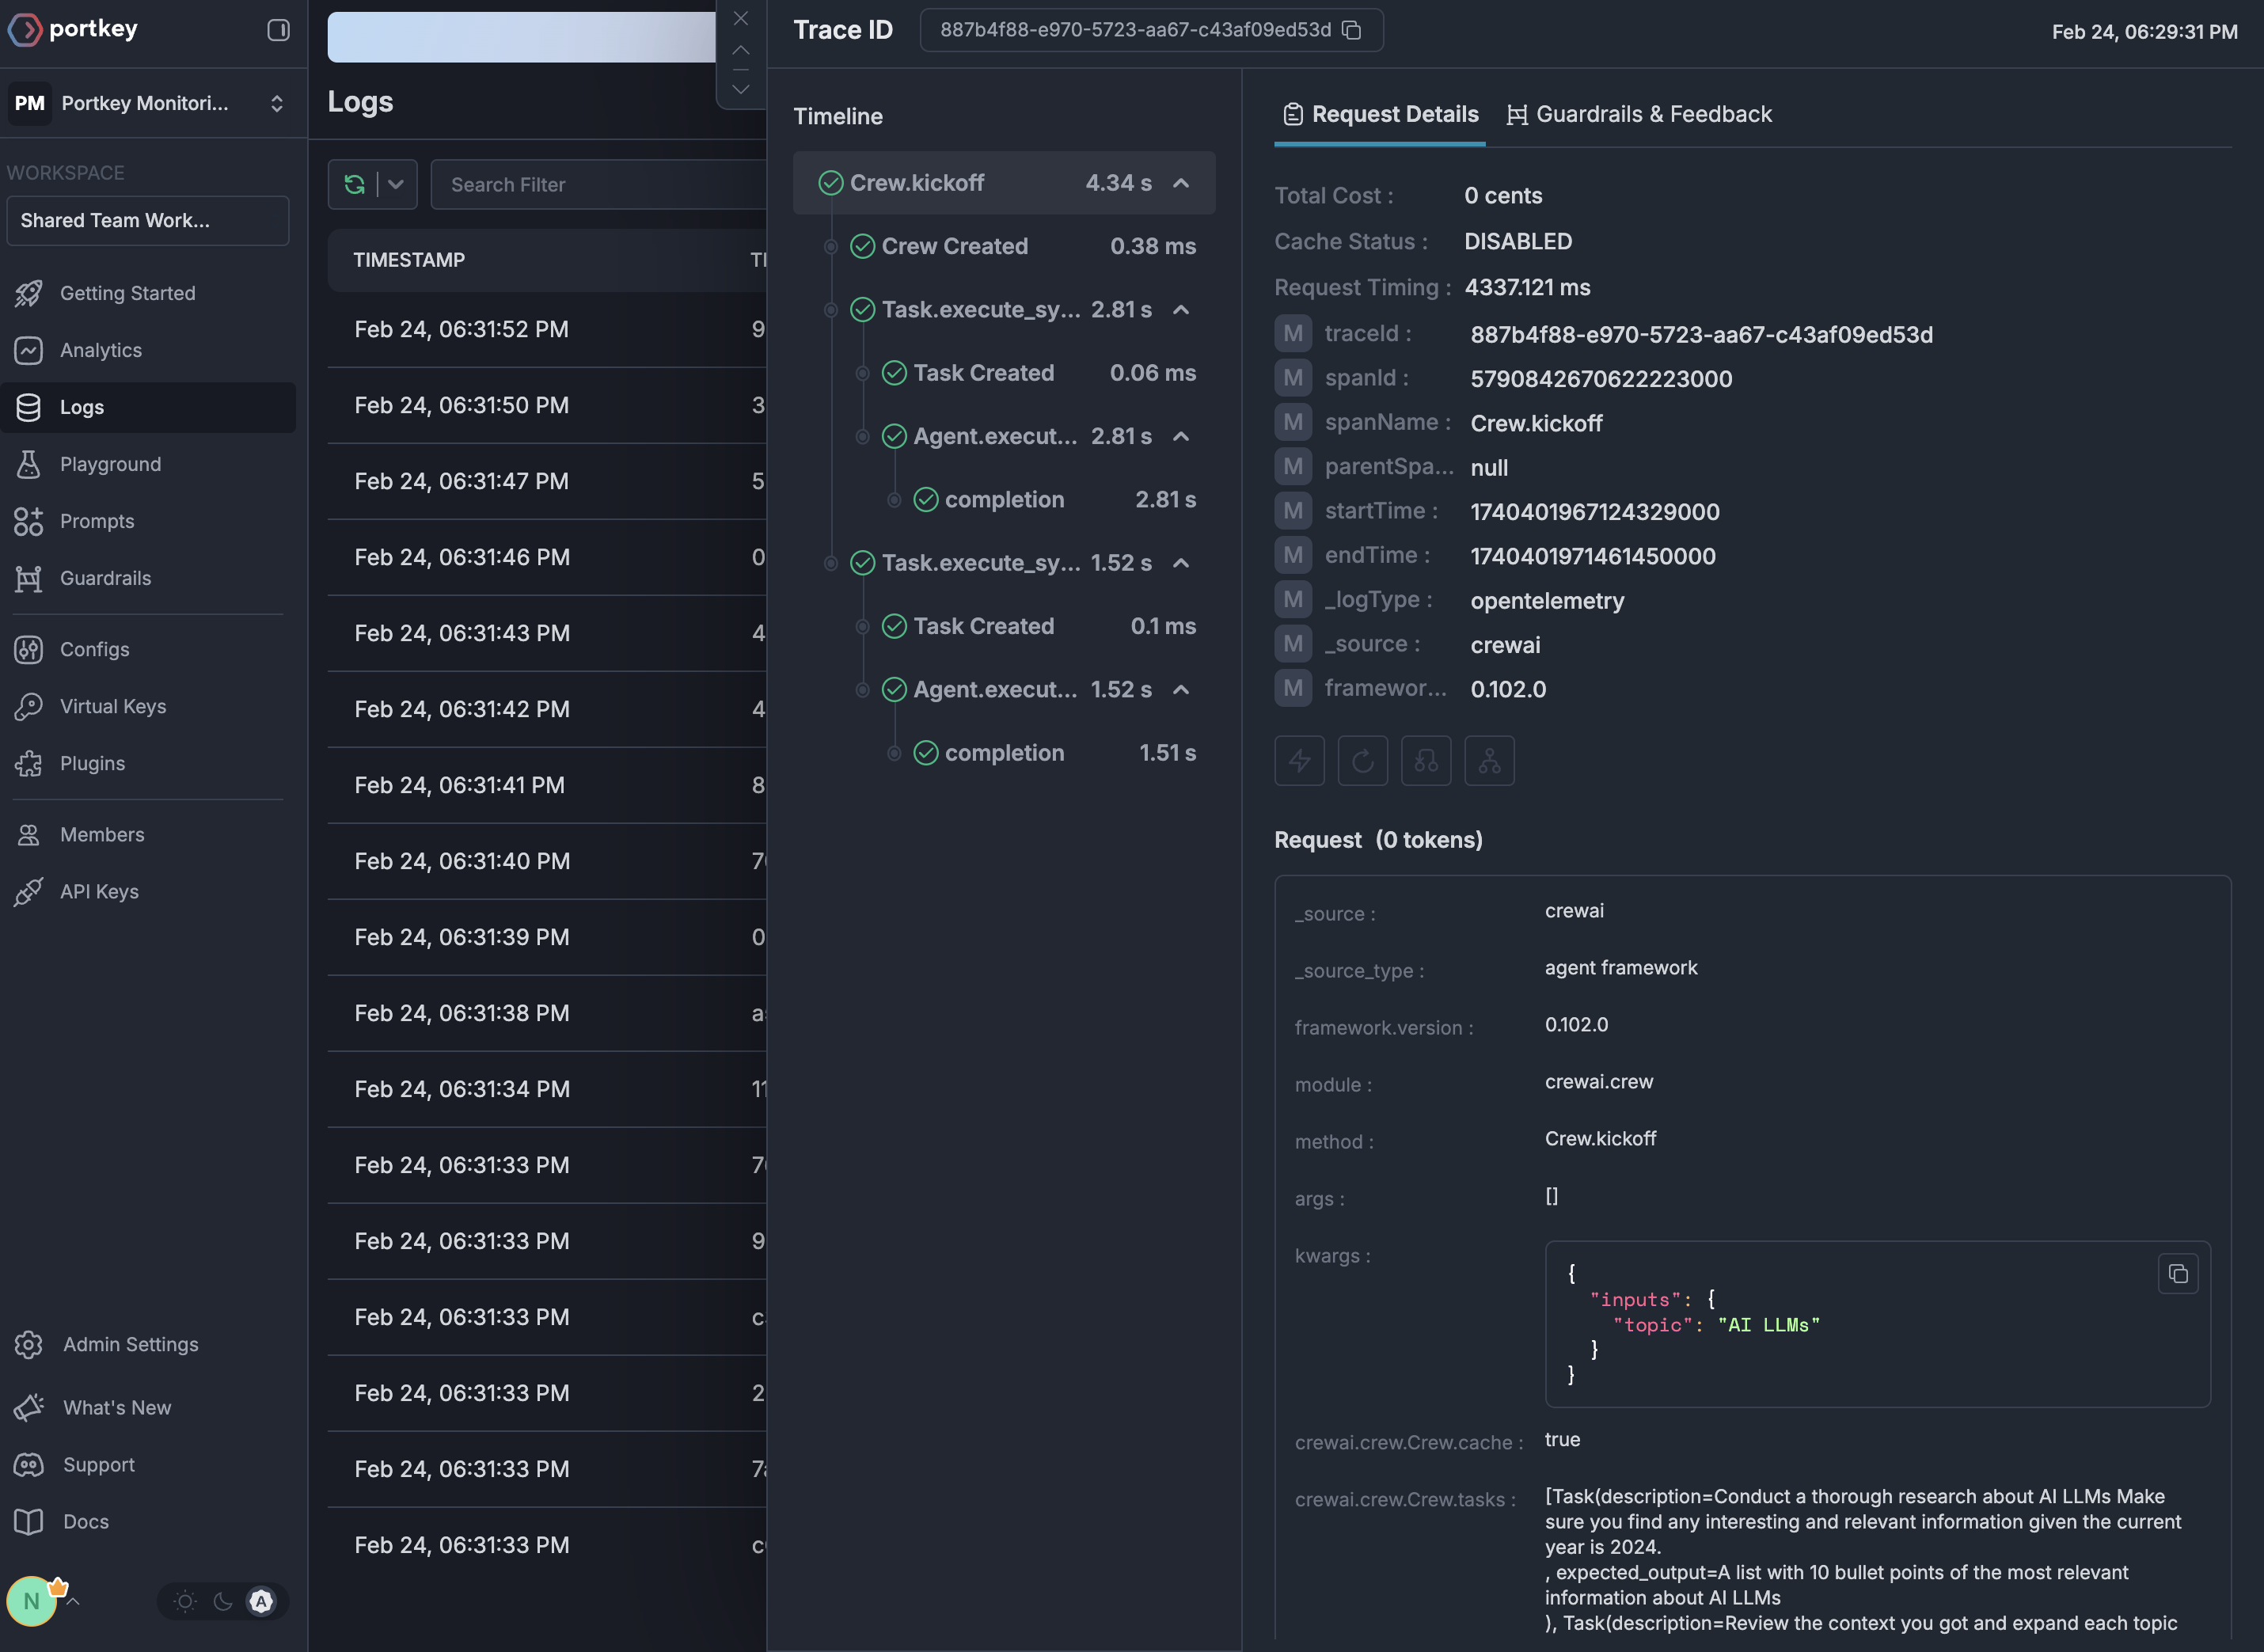
## See Your Traces in Action
Once configured, navigate to the [Portkey dashboard](https://app.portkey.ai/logs) to see your Traceloop instrumentation combined with gateway intelligence: